
Has the Magic Gone?
Examining what's so magic about Greenblatt's famous magic formula

Back in April 2023, I wrote an essay titled How the Small Investor ‘Could’ Beat the Market where I outlined Joel Greenblatt’s 1981 paper on buying stocks below their liquidation value. The original paper’s title included the words ‘can beat the market’ but I replaced it with ‘could’ to indicate the theory is outdated in modern markets. You can check that out below.

The liquidation value paper is slightly more complex, and not as well known as Greenblatt’s other work; like his “magic formula” that he references throughout his book; the little book that beats the market. The latter is simpler and is arguably more relevant today. I decided to conduct some magic formula screening and will demonstrate how you can do that; as well as seek to understand if it actually works. Once again, Greenblatt took influence from Benjamin Graham, who once had a “magic formula” of his own. Deciding that Graham’s formula was too limited for current markets, Greenblatt devised his own.
“If it makes you feel any better, even the great Benjamin Graham - wrote about and used a magic formula of his own. Okay, so he didn’t really call it that (apparently, the man had some dignity). But Graham felt that most individual investors, and even many professional investors, would have a hard time making the type of predictions and performing the level of analysis necessary to value and invest in businesses on their own. Graham figured that by sharing a simple formula, one that made sense and had worked well in the past, individual investors would be able to achieve excellent investment results with a high degree of safety”.
Joel Greenblatt
The Magic Formula
“Choosing individual stocks without any idea of what you're looking for is like running through a dynamite factory with a burning match. You may live, but you're still an idiot”.
Joel Greenblatt
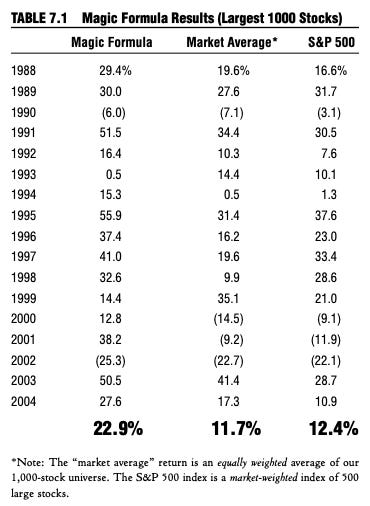
The magic formula is straightforward. Greenblatt used this practice to filter down a large investment universe into a smaller one and create a basket of companies that can be examined, acquired, and then rotated on an annual basis. He was looking for what he called “cheap” companies, but you are able to alter the screen inputs at your own discretion. The idea is that you repeat this process once a year, at a minimum, and each time the screening output would be different. When backtesting, the formula had impressive results; earning a 10% annualised premium to the S&P 500 over the study period.
There are four steps to the process.
Identify the investment universe with a screener
Rank the stocks based on earnings yield and ROC
Chose the basket of equities you want; diversify
Rebalance regularly & monitor performance
I will be recreating it using a Koyfin screener. There are other tools you can do this with, but Koyfin is by far the easiest.
1) Identifying the Investment Universe
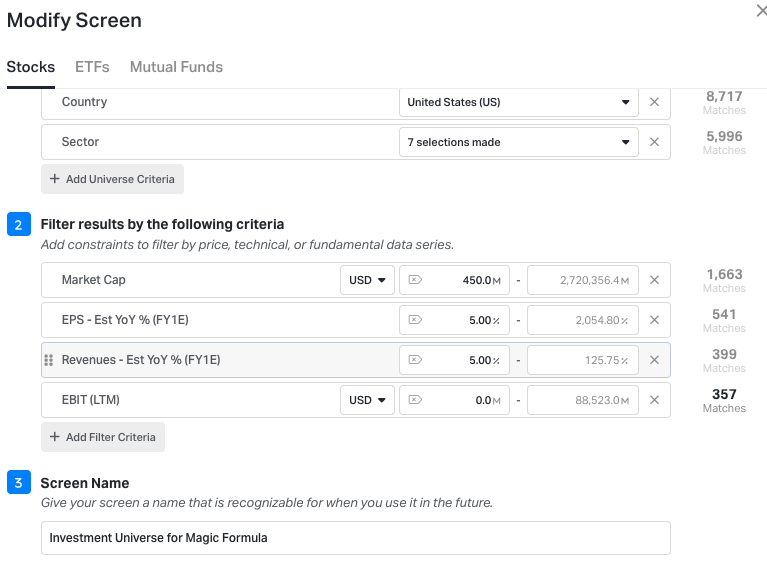
The first step is vague by design; because each investor’s preferred investment universe is different. There may be certain market cap sizes, countries, exchanges, sectors, or various other screening data series that you feel more comfortable hunting in. In his book, Greenblatt “starts with a list of the largest 3,500 companies available for trading on one of the major U.S. stock exchanges” and excludes companies in the financial utility sectors.
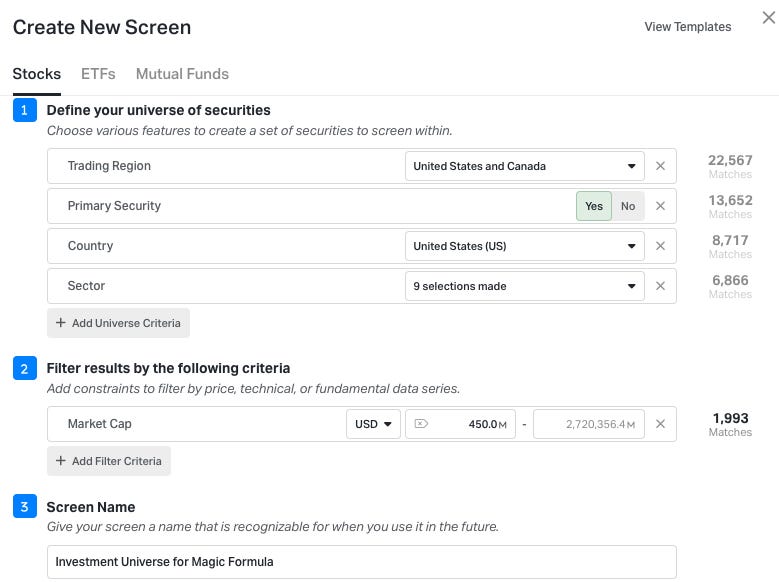
I decided to filter on only US stocks, excluded the two sectors Greenblatt suggests, and entered a market cap range of $450 million and above; yielding 1,993 results.
2) Rank the stocks based on earnings yield and ROC
I saved the screening output as a watchlist and began the process of ranking by earnings yield and return on capital; following Greenblatt’s steps.
“It then assigns a rank to those companies, from 1 to 3,500, based on their return on capital. The company whose business had the highest return on capital would be assigned a rank of 1, and the company with the lowest return on capital (probably a company actually losing money) would receive a rank of 3,500”. Next, the formula follows the same procedure, but this time, the ranking is done using earnings yield. Finally, the formula just combines the rankings.
Joel Greenblatt
By combining the rankings, the formula looks for the companies that have the best combination of those two factors. Investors would then order the companies by ranking, and pick the best 20-30 names. But what about the influence of luck? Are the returns of the backtest simply coincidental, or is there something in this strategy that causes the above-market returns? For instance, in 1999 Jason Zweig noted in Money Magazine that you could have beaten the market by 1.3% between 1980 and 1999 by buying the 10,500 stocks that had no repeat letters in their names.
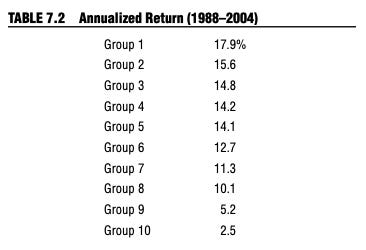
In an effort to disprove the factor of luck, Greenblatt ran a second backtest, this time taking a sample size of ~2,500 companies, and creating 10 portfolios grouped by their percentile rankings; with Group 1 having the best 250 rankings, Group 2 the next 250 best rankings, and so on.
“Straight down the line from Group 1 to Group 10. Group 1, our best-ranked stocks, beats Group 10, our worst-ranked stocks, by over 15 per cent a year”.
But why earnings yield and return on capital? Greenblatt felt that earnings yield enabled the investor to reflect how the price paid for an equity stake in a business as well as the debt financing used by a company helped generate operating earnings; through its use of enterprise value instead of market valuation.
Earnings Yield
- EBIT / Enterprise Value


Return on Capital
- EBIT / (Net Working Capital + Net Fixed Assets)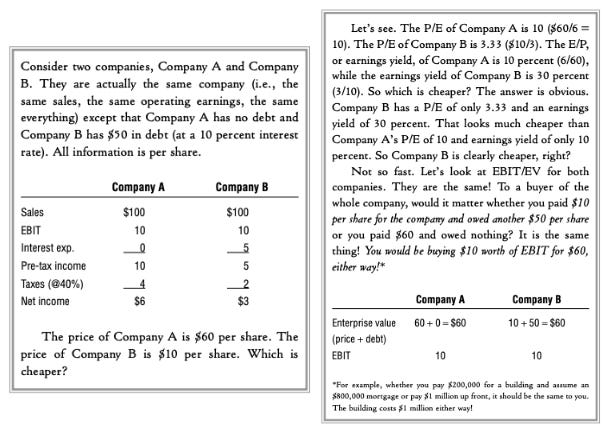
The return on capital was used for several reasons; EBIT to nullify the distortion of debt levels and tax rates, and NWC + NFA to figure out how much capital is actually needed to conduct the company’s business1. To replicate this in Koyfin, there are a few steps.
Step 1 - Add ROC and Earnings Yield Columns
Koyfin already calculates the return on capital data series, so that is as simple as selecting it from the column choices.
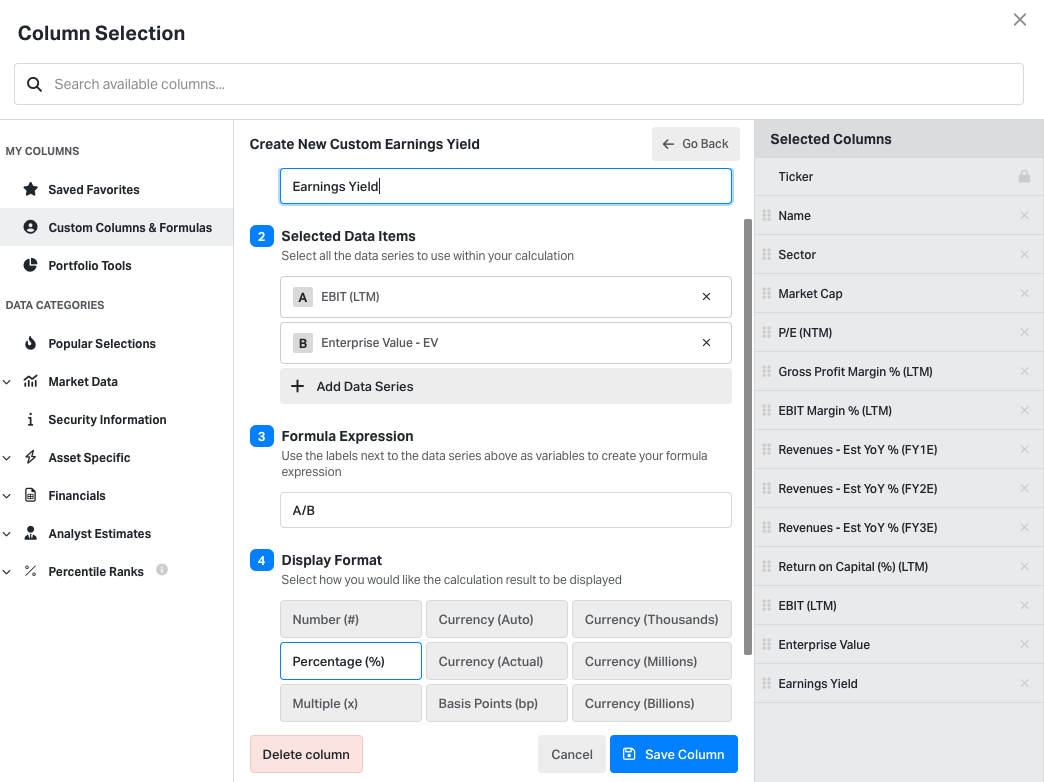
For earnings yield, it requires the use of a custom formula, as shown above. Add trailing EBIT2 and enterprise value as the data series, express them as EBIT/EV and display it as a percentage.
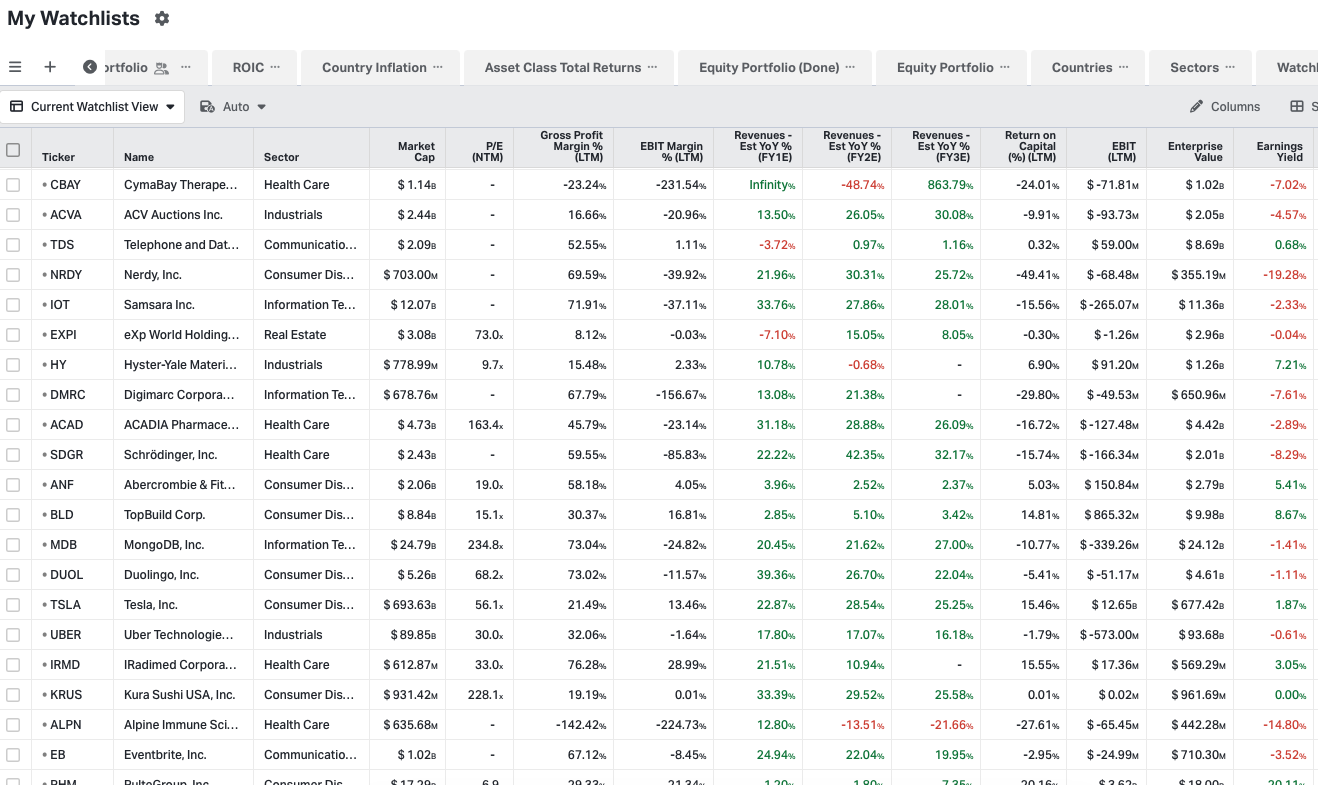
Following that, you will have a watchlist populated with your investment universe, their earnings yield, and their return on capital; as well as any other columns you deem necessary.
Step 2 - Excel Time
Using a little old friend of mine called Microsoft Excel will allow me to sort and rank the stocks, and add up their combined rank.
Download the watchlist from Koyfin into CSV format.
Sort the data (highest to lowest) to show the best earnings yield at the top and the worst at the bottom.
Then assign a ranking from 1, and sort the list from A to Z by ticker.
Repeat the process for ROC, and you should have two lists of identical investment universes, ordered by the ticker from A to Z, with their respective ranks for earnings yield and ROC.
Now create a third table, add those two ranks together for each security, and order the combined rank from lowest to highest.
You should have something that looks like this.
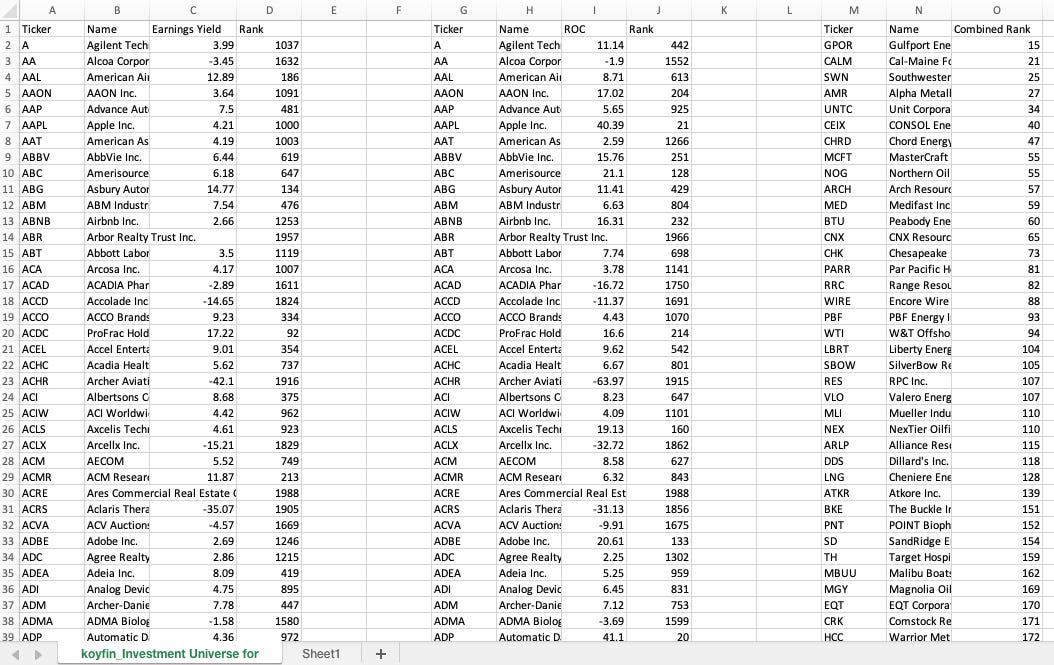
You now have a list of the investment universe ranked by a combination of earnings yield and return on capital. The next steps would be as follows.
3) Chose Basket and Diversify
Greenblatt makes it clear that you should not pick the top 30 companies by order of ranking, buy them all at once, and then go to the beach. The premise of this list is that it provides the investor with a fertile hunting ground of options to go and study further. Ideally, you are supposed to spend time picking stocks from the top percentile of rankings, accumulating 2 to 4 positions per month over a 12-month period, and diversifying across sectors. At least, that’s what Greenblatt suggests.
And let’s not forget you can filter down the investment universe further before you begin any of this. For example, using the same screener but removing energy and real estate in addition to finance and utilities, and requiring the output to include only companies that are EBIT profitable and expected to grow EPS and revenue by at least 5% in the following year whittles the output from 1,993 matches to just 357.
Take this newly modified screener and expand the search radius to the 142 countries that Koyfin provides data for and the output climbs back up to 2,129 matches. Sure, there might be more than the original, but I’d argue with these additional filters the investment universe will eradicate a lot of terrible companies. You might also be inclined to add valuation-related screening criteria to weed out companies trading at 100x forward earnings.
4) Rebalance Regularly & Monitor Performance
This strategy is not intended to reproduce a coffee can portfolio. The original idea was that the investor would repeat this process semi-regularly; rebalancing the portfolio at least once per year. Greenblatt advocated for selling losers one week before the year mark and selling winners one week after the year mark. For investors who like to avoid transaction costs and high turnover, this might be a problem. Despite Greenblatt claiming it’s a long-term investing strategy and one that helps remove the impulse of reacting to short-term price fluctuation, this is perhaps a strategy more tailored to the active value investors of the world. Personally, I wince at the idea of having a new portfolio every year.
To recap:
Structure an investment universe
Rank those stocks using earnings yield and ROC
Combine the ranks
Search your newly fertile hunting ground
Acquire positions and diversify
Pray to god, and regularly rebalance the portfolio
That’s how the formula works, but does it actually work?