How the Small Investor 'Could' Beat the Market
In 1984, a 24 year old Joel Greenblatt published a paper on buying stocks that are selling below their liquidation value
In 1981, a 24-year-old, Joel Greenblatt authored an essay in the Journal of Portfolio Management titled ‘How the small investor can beat the market’ alongside Richard Pzena and Bruce Newberg. Together they shared outlined their process for buying stocks selling below their liquidation value. Inspired by Benjamin Graham, Greenblatt & Co fathomed what they might find if they refined Graham’s ‘net-net’ universe by removing the crud; a combination of Graham’s approximation of liquidation value and the PE ratio. The results, calculated over a six-year period, are impressive, and I have some thoughts. The essay is notoriously difficult to attain (seriously, I tried), but I eventually found one through a connection. If nothing else, it might provide some food for thought or serve as a summary of this well-regarded paper.
Ignore the academics
The essay starts off with a dismissal of the efficient market hypothesis.
“Past experience and common sense tell us that the individual investor has little chance of outperforming in the stock market. After all, even the billion dollar institutional funds, with their greater access to timely information and comprehensive analysis, have been notably unsuccessful in their efforts to achieve superior long-term investment results”.
Ironically, the expertise of Wall Street portfolio managers has its own part to play in their disappointing performance. According to the academia of the time, competition between these professionals ensures that stocks remain efficiently priced at all times (an idea which still persists in 2023). If all publicly available information is absorbed into equity valuations, then there are no bargains to be had. Attempting to beat the market is, therefore, a loser’s game.
“We should recall, however, that Wall Street research houses limit their coverage to fewer than 500 actively traded issues. Meanwhile, the NYSE trades 2,000 stocks, the Amex trades 1,000 companies, and the OTC market trades another 7,000 issues that are required to provide relatively full disclosure to the SEC”.
While the numbers may differ today, something which holds true that is institutions are still mandated to neglect certain stocks. Many of them are too small, or illiquid, to be covered by these firms. For this reason, many investors believe there will always be unrecognised value in the market. This is where Benjamin Graham comes in.
"In his textbook, Security Analysis, he outlines in little more than a page the opportunities to be found in stocks selling below their liquidation value. In studies between 1923 and 1957, Graham reported superior results when market levels enabled him to buy a diversified list of these bargain stocks”.
In an effort to discover how to find these inefficiently priced companies, the trio utilise Garham’s approximation of liquidation value.
The assumption is that all current assets less all liabilities and preferred stock approximate the liquidation value because any loss on the liquidation of inventories and receivables will be made up through the liquidation of fixed assets (land, machinery, etc). This process was intended only to be a “rough screening device” to sort out the likely prospects from the thousands available.
“Clearly, on a theoretical level, it is possible for a stock to be selling below liquidation value if the discounted cash flow of its future earnings results in such a lower valuation and if there are no immediate prospects for liquidation. Firms losing money, or those firms expected to lose money in the future might reasonably be selling at sub-liquidation prices”.
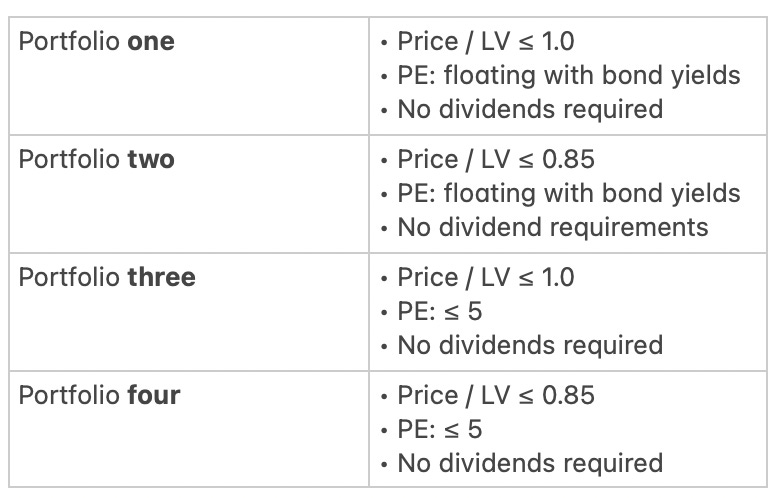
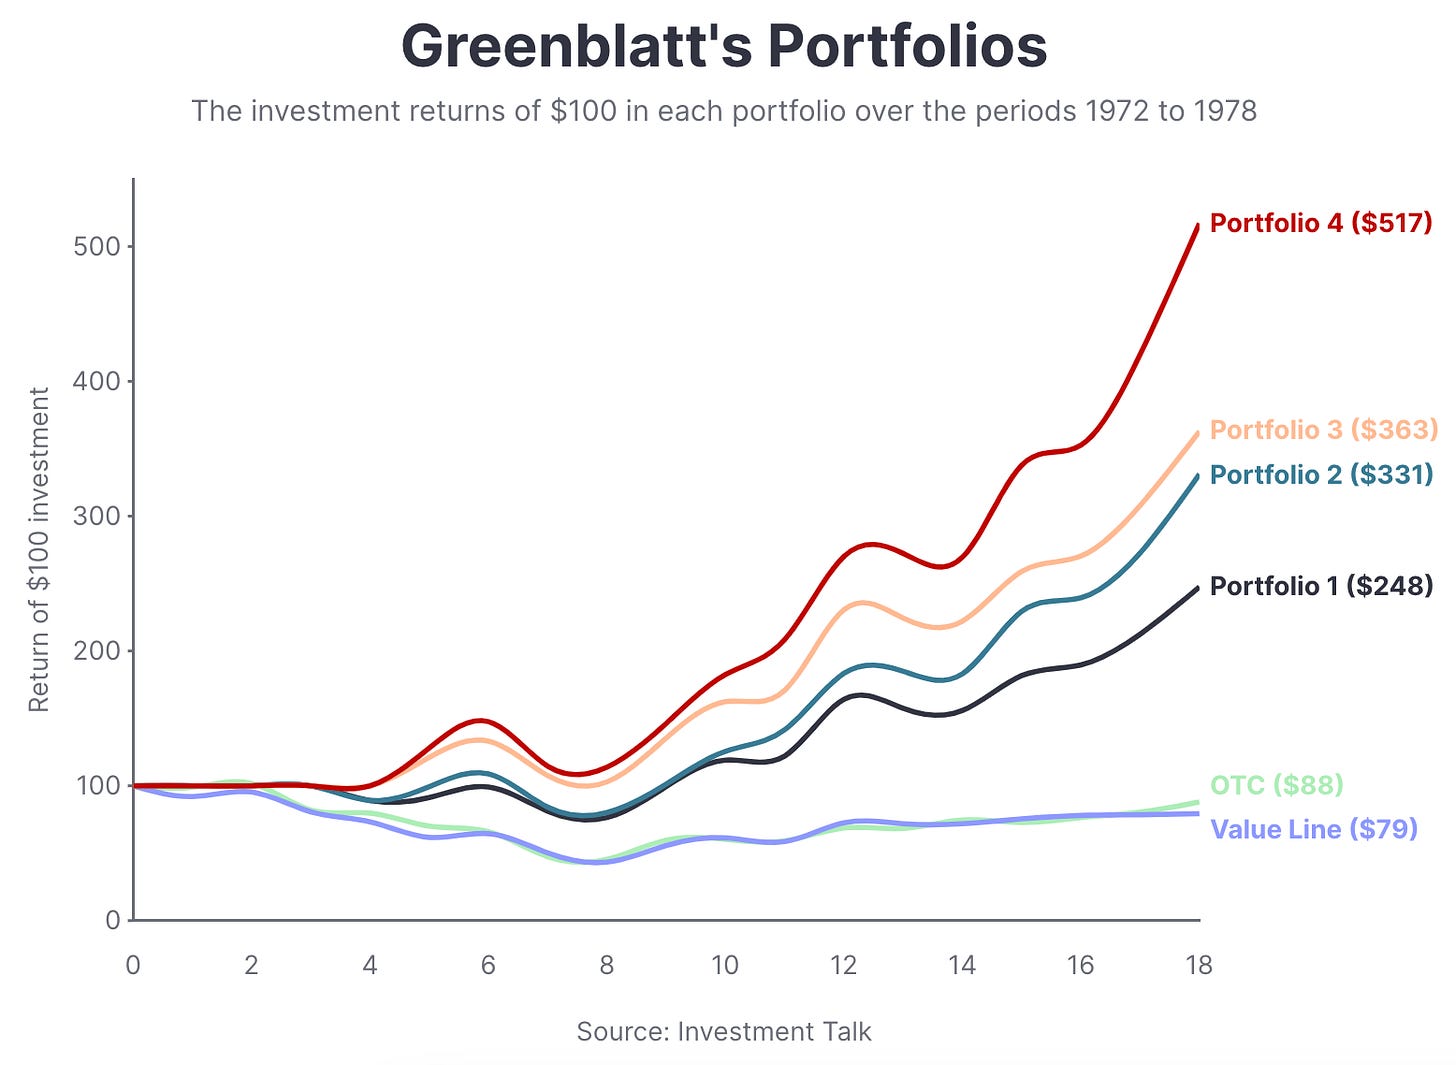
In an effort to eliminate the crud, the study excluded companies showing a loss over the trailing 12-month period. Combining liquidation value and the PE ratio, Greenblatt constructed four unique portfolios and compared their performance to that of the OTC1 and Value Line indexes across 18 four-month periods from 1972 to 1978.
A computer program would purchase any stock2 that met the above criteria and the team would sell each stock after a 100% return or after 2 years had passed; whichever came first.
The Results
An initial $100 investment across the OTC and Value Line indexes would return $88 and $79, respectively. After six years, portfolios 1 through 4 returned a range between $248 and $517.
Portfolio 4 ($517) was the highest-returning vehicle and selected only those stocks which were valued the lowest in the sample with relation to PE (≤ 5) and LV (≤ 0.85). Portfolio 3 ($363) allowed for the same PE ratio (≤ 5) and a higher LV value (≤ 1.0) and was the second-highest returning vehicle.
Portfolio 2 ($331), despite restricting the universe to a lower LV (≤ 0.85) of stocks than portfolio 3, underperformed slightly. Portfolios 1 and 2 set PE thresholds at a floating rate, equal to “twice the prevailing triple A rated yield” in the period. E.g, if triple A rated yields were 8%, the PE would be ~6.25. As it happens, yields ranged from 7% to 9% during the period, so we can assume that the PE value was considerably higher for portfolios 1 and 2.
Portfolio 1 had, collectively, the highest values for LV (≤ 1.0) and PE (5.5 to 7) and performed the worst. The study suggests that searching for profitable stocks that have an LV ≤ 0.85 and PE ≤ 5 is the most attractive fishing spot for stock pickers. This backtest appears to have yielded impressive results, but I have a few comments about the legitimacy and reliability of the study; abstract from the typical flaws of backtesting such as human error, period bias, survivorship bias, etc. Below is the return data in raw form.


