
Building for Advisors
PLUS: Integrations, Reports, 2FA, Koyfin Assistant, Quick Actions, and More

I try to stay in the present as often as I can; only looking forward or backwards with purpose. I find it best to assign time to this kind of contemplation and move once that time expires. As I have been reflecting on everything we have shipped this year at Koyfin, I am reminded of the importance of spending a little time looking backwards. It’s been a great year, I feel like I have developed a lot as a product manager and, as a team, we released a mountain of new features.
We are also on the cusp of releasing something huge (with a capital Y). I’d say it’s firmly in my top two for features i’ve worked on in my two years at Koyfin. I’ll write more about that when the time comes, but for now, I wanted to catch up since the last Product Work update I shared back in August.
Below is a variety of the things we have released at Koyfin over the last three months, with some commentary.
1. Advisors
A central theme at Koyfin over the past 18 months has been Advisor workflows. We have incredible word of mouth at Koyfin and are blessed with an abundance of different user personas from the arms of an umbrella of two larger buckets I’ll just refer to as individual researcher types and professionals/teams. Within the professional bucket, we had a strong following among Financial Advisors despite lacking some of the core workflows they needed. We’ve undergone a journey to incorporate more of those workflows into the platform.
Two years ago, Koyfin lacked any portfolio functionality. Today, we have a library of them from My Portfolio for individuals to aggregate their brokerage accounts and track P/L and exposures, Model Portfolios to create custom baskets and proposals, and Client Portfolios to help bring the proposals into the real world with more emphasis on P/L and lot management. On top of that foundation, we have expanded into custodial integration and report generation, and that’s just getting started.
Creating a platform that an individual like me can use at the same time as an Advisor with more nuanced and advanced needs doesn’t come without its dilemmas. We launched an Advisor Pro tier this September to create a clearer distinction between functionality and guidance towards the right plan for a user.
1.1 Client Portfolios
The Model Portfolio functionality began development ~18 months ago and is a core advisor workflow. Advisors use models for all manner of reasons. As far as acquiring clients go, the model acts as the proposed portfolio. These portfolios are based on allocations, and dynamic weightings, and are flexible enough to be used for various purposes. It’s a tool for comparing the client’s current portfolio and fee structure vs. what the Advisor can offer as an alternative.
When the potential client becomes a client, the Client Portfolios function switches focus from simulation to reality. These portfolios are based on the actual structure of the client’s real-world portfolio, with a focus on quantities, lot management, purchase dates, P/L, and total return.

While the UI appears similar to My Portfolio, a feature built for the individual, the Client Portfolios hub allows for multiple portfolios to be created as opposed to a solitary portfolio. Advisors can create, upload, or import, hundreds or thousands of their client portfolios into a central hub and are equipped with the portfolio analytics they need.
Client Portfolios also introduce the concept of a workspace within Koyfin. For teams of Advisors, the Client Portfolios hub can be shared across a multitude of users at once, making portfolio and client management more collaborative.
1.2 Custodial Integration
We introduced our first integration by allowing Advisors to connect to the Schwab Advisor Center to import their client accounts directly from Schwab.

We are early in the integration journey, with greater functionality and a broader range of integrations on our roadmap, but it’s an exciting path to be on which removes friction for Advisors who want to use Koyfin as their primary analytics platform.
1.3 Reports
Report generation tools are a crucial workflow in the acquisition of potential clients and for internal purposes. From our feedback sessions, we understood that Advisors were frustrated at the lack of flexibility in most offerings. They wanted discretion in what gets included in the report and greater customizability.

We took this on board as we developed our first iteration of Koyfin reports, which allow users to generate reports on funds, models, and client portfolios that cover allocations, performance, risk, and portfolio breakdowns. These reports can be used on a single-entity or comparative basis and allow users to add logos, brand colours, and custom text pages for things like investing policy statements or disclosures. The order and inclusion of individual exhibits can be adjusted too.
The initial feedback has been great, and we are already working on the next version of reports to upgrade the functionality further.
1.4 Portfolio Sleeves
If you are not familiar with the concept of Portfolio Sleeves, I suggest watching Christopher Nolan’s Inception; it’s a portfolio within a portfolio.

Sleeves let users combine multiple models into one larger, more complex strategy, helping users build custom asset allocation models by pulling together different components (models), making it easier to tailor investment strategies to their clients’ needs. The underlying holdings of the sleeves will be surfaced in all exposure and report exhibits too.
2. Other Great Stuff
Besides building out Advisor workflows, we have been busy adding functionality that benefits every user. Below are a handful of some of my favourites from the past three months.
2.1 Comparison Graph
At Koyfin we have several core charting functions. The Historical Graph (G) is the Swiss army knife. It does everything and is the most customizable, powerful, and versatile chart tool we have. To make certain charting flows faster and more efficient, we created the Intraday (GIP) and Performance (GM) graphs which are designed to do one job. Intraday proves intraday prices and % changes up to a range of 10 days. The Performance graph provides the total return and CAGR for any security added to the chart. Both are simplified and only contain a menu to add securities instead of a full library of metrics. It gets you from A to B much faster than doing it on a Historical Graph.
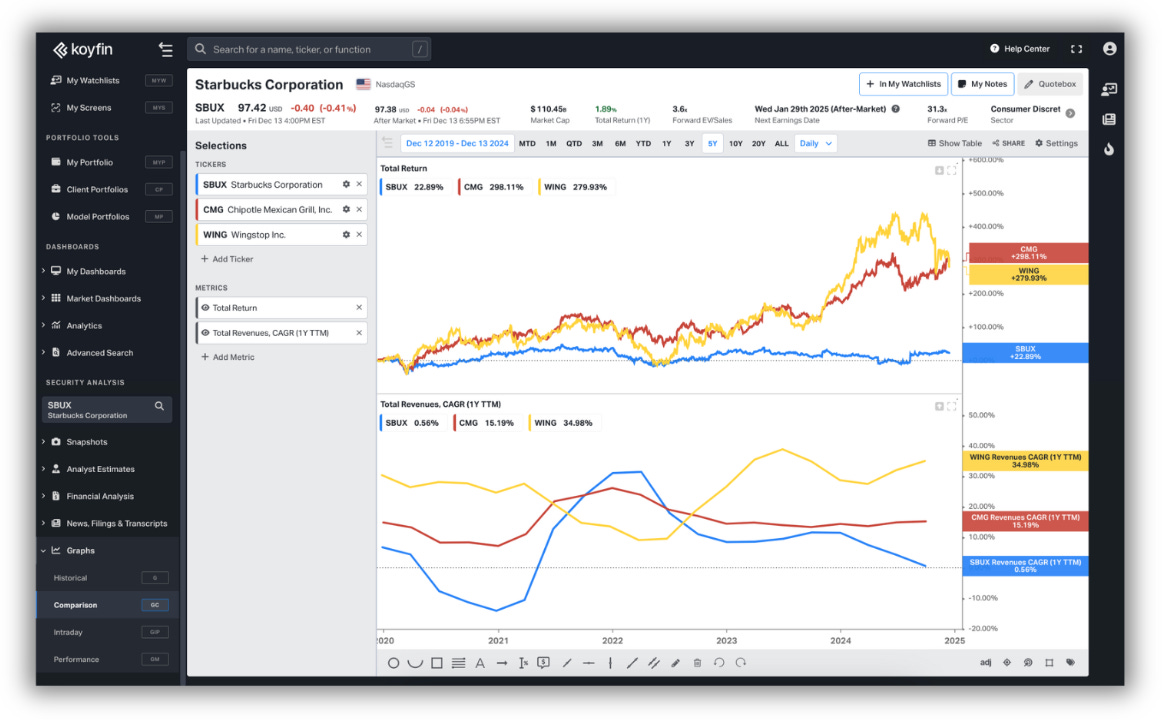
The Comparison Graph (GC) is designed as another one of those simplified charting workflows. This chart is designed specifically for comparing metrics across companies and includes features like colour-syncing, auto-syncing of panels, and a different UI for ticker and metric selection. While more efficient than the Historical Graph for this particular workflow, it’s not as flexible concerning merging panels, hiding individual metrics from select tickers, and some of the formatting options for chart styles.
2.2 Quick Actions in Watchlist
Quick Actions are a way to overlay functions on top of a watchlist whereby the watchlist acts as the ‘universe’ on which the function is based. For instance, a customizable feed for filings, news, press releases, and transcripts.

We also added a scatter plot to the Quick Actions menu. In the near term, we have a lot of other functions we could surface here, such as the earnings calendar and the Lots of Charts dashboard. While it’s possible today to use a Watchlist as the universe for these functions, the Quick Actions menu makes this possible without navigating away from the Watchlist section. It also opens the door to creating new, unique, functions such as histograms, bar charts, and more.
2.3 Koyfin Assistant
In beta at the time of writing, we released our first consumer-facing artificial intelligence feature this month, the Koyfin Assistant.

The goal of the Assistant was to assist in support queries rather than being a fully-fledged co-pilot. The knowledge base will help users navigate the platform, inform them how to use features, and provide context on data coverage, functionality, and more. It’s not there to provide stock tips, and it doesn’t currently have access to our data (e.g., asking what Apple’s revenue was in FY22 compared to FY21).
This will be particularly useful for the thousands of new users we onboard to Koyfin each week, most of whom have simple questions the Assistant can handle. While it may appear a small step, it excites me when I consider the other use cases we can develop to improve the platform and reduce the learning hurdle.
2.4 Two-Factor Authentication (2FA)
Following the launch of custodial integrations, and with plans to integrate with more service providers, 2FA was necessary to maintain the level of security throughout the chain. This helps keep you or your client’s sensitive data secure.

Users can now enable 2FA from the profile settings with an authenticator app.
2.5 Fund Percentiles
Koyfin’s percentile ranks are one of the unique datasets we have on the platform. Previously reserved for equities, we created a set of percentiles for US and Canadian ETFs and Mutual Funds.

Users can now see percentiles across performance, characteristics, and quantitative categories. For US ETFs, there are valuation multiples and yield percentiles too. The data is available as a column selection in tables, the screener and the visualized snapshot format.
2.6 3Y and 5Y Equity Percecentiles
In addition to adding fund percentiles, we bolstered our equity percentile offering, adding 3Y and 5Y variants to the existing 10Y and 20Y periods.
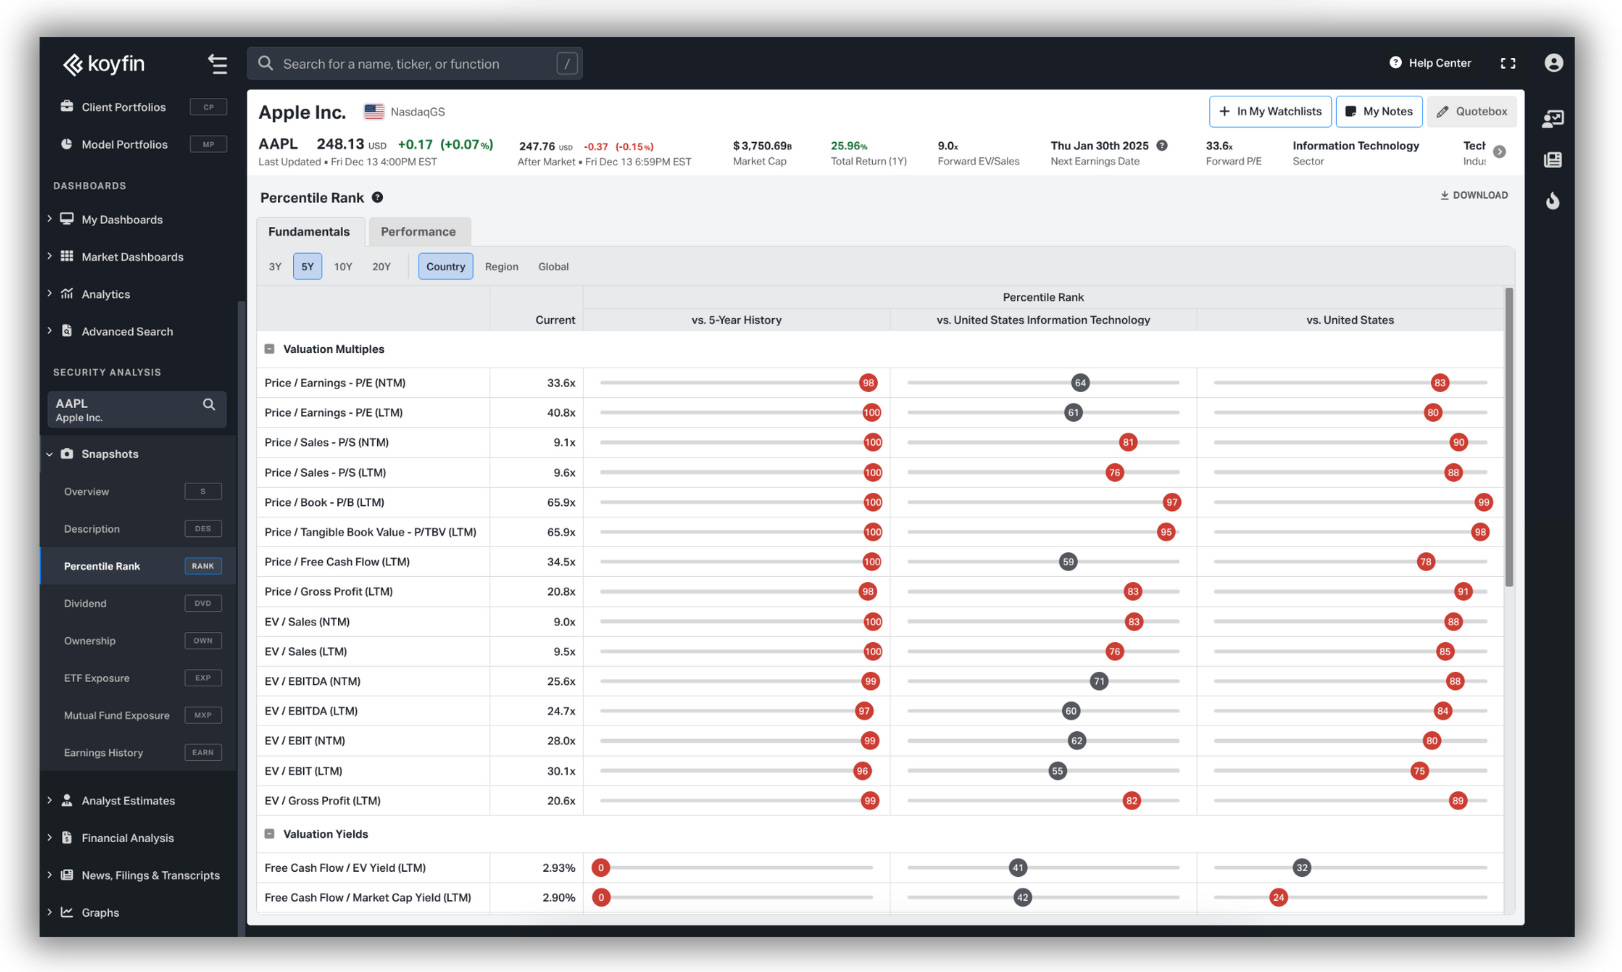
This allows for a more holistic, well-rounded, view of an equity’s percentile scores and provides context for both long-term and short-term trends.
2.7 Linear Regression and R2
Linear regression is a statistical method that models the relationship between two variables by fitting a straight line (regression line) through the data points in a scatter chart. It helps to identify trends and predict outcomes while the R² (coefficient of determination) identifies the proportion of variance. In other words, how strong the relationship is.

We added a simple linear regression and R² annotation to our scatter charts which are used throughout the platform on the back of user requests. One improvement we can make here is allowing users to omit outliers from the chart, thus removing them from the equation in tandem.
2.8 Benchmarked Exposures in MYP and CP
The development of the three portfolio features began at different periods. They cater to different needs, so shouldn’t be identical in substance or style, but there were a few gaps in feature parity. Namely, the exposure exhibits of the portfolio.

In My Portfolio (MYP) and Client Portfolios (CP) we introduced richer exposure exhibits (that Model Portfolios (MP) already had) that came with several great upgrades:
X-ray exposure for funds: We now look underneath ETFs and Mutual Funds to provide exposure breakdowns of the underlying holdings. For instance, a portfolio comprised of 100% S&P 500 ETF represents the exposure of those 500 or so companies.
Benchmarked exposure: Users can toggle between showing exposures at the portfolio level (via pie charts) or vs. a chosen benchmark (via bar charts).
11 new exhibits: From 5 to 16 unique exhibits, we broadened the type of exposure analysis users can conduct on their portfolios.
Interactive holdings table: Previous exposure pages were aggregated to the top level. For instance, in a sectoral exposure table, we would show you the weight (%) of each sector in the table. Now we break down the underlying holdings of each category and allow users to filter by subcategory (e.g., by consumer discretionary)

2.9 Crypto Support in Portfolios
Plain and simple, we added support for cryptocurrencies in portfolio features.

2.10 Enhanced Currency Support in Portfolios
Across the portfolio features, the portfolio currency is important because all positions, P/L, and returns are converted back to that currency. We increased the number of supported currencies from 11 ➝ 90 to ensure that everyone can make use of the features.

While the bulk of our users reside in either the United States, Canada, or Europe, we have users from across the world and this would have been a welcome update.
I hope to be back discussing another huge product update shortly but until then.
Thanks for reading,
Conor