Charts Charts Charts
Friday 14th April, 2023

Hey, you are reading Investment Talk. If you’d like to join the 20.6k other readers learning about life, the stock market, and the companies within it, subscribe below. Charts Charts Charts is your weekly curated snippets from the stock market.
If you enjoy today’s article, feel free to share it or like it, as it greatly helps. Now let’s begin.
1. US unemployment claims just to 239k
“Initial weekly US unemployment claims rose by 11k to 239k, led by jump in California. Continuing claims, which include people who have received unemployment benefits for a week or more and are a good indicator of how hard it is for people to find work fell to 1.81 million”.
//
“That's still low by historical standards, but it's clear that the trend has shifted. New claims in year-over-year terms rose for a 7th straight week--an early sign of weaker labor market conditions ahead”.


2. March PPI downside surprise
“March PPI with a significant downside surprise at -0.5% m/m vs. 0% est, and 2.7% y/y vs. 3% est. While energy was a big drag, services was the weakest since Mar 2020. Cooling in demand coming through in this data”.


3. US CPI (inflation) at 5% in March
“This CPI report leaves little doubt that the disinflationary process is well underway. Slower growth in final demand for goods and services, easing housing price inflation and moderate wage growth should combine in the coming month and lead to faster disinflation than expected”.

4. CPI down for 9 straight months
“Headline CPI down on a year/year basis for the 9th straight month. That hasn't happened in more than 90 years”.

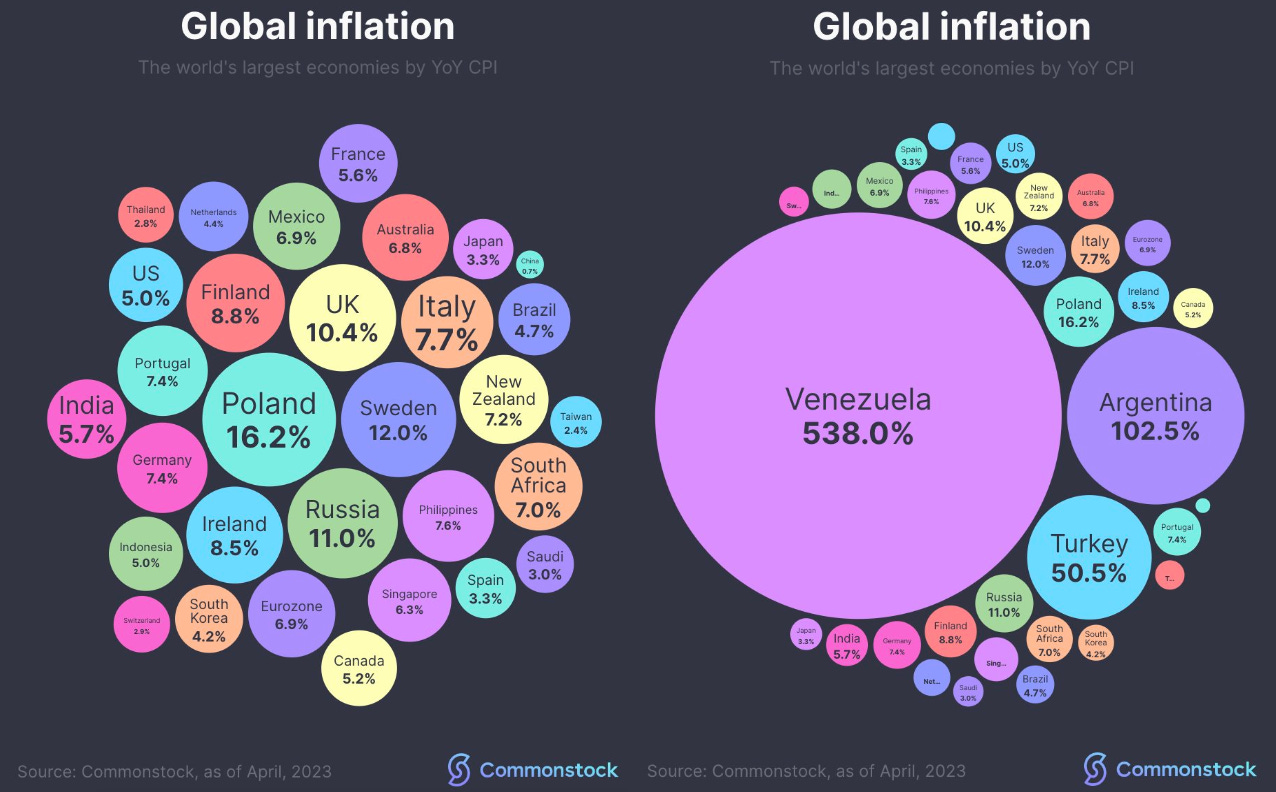
5. Global inflation rates falling
“Global inflation rates of the world's largest economies. Every country on this chart is showing YoY declines in CPI apart from; New Zealand (unchanged), Ireland, Finland, the UK, and Sweden. Here's the chart if we include Venezuela, Argentina, and Turkey”.