


Good morning,
Today i am sharing with you a piece i wrote on Amazon back in August, that was sent out to subscribers.
I post things like this 5 days a week for subscribers, and i am happy to say that until Friday 23rd October, i am offering a 50% Discount on the subscription fee for those interested.
If you fancy receiving stuff like this on a daily basis, try it out!
Amazon is a company known, most likely, to everyone reading this, but i can assure you the financials are very interesting indeed. I have been looking forward to this one.

I would like to state that i do not have a position in Amazon, nor do i intend to take one at this current moment in time.
Business Overview
I am fairly confident we are all aware of Amazon. One of the largest companies in the world, Amazon currently support a market cap of around $1.4 Trillion dollars after the company went public in 1997 at with founder, and current CEO, Jeff Bezos at the helm. Originally an online book merchant, Amazon have now grown to become one of the giants of online retail and have revolutionized e-commerce, employing over 798,000 full time workers across their operating segments. Amazon’s desire it to be the “Earth’s most customer-centric company” and are driven by four principles:
1) Customer Obsession rather than competitor focus
2) Passion for invention
3) Commitment to operational excellent
4) Long-term thinking
Amazon serve a multitude of operating segments with their product and service offerings that largely consists of consumers, sellers, developers, enterprises and content creators. Amazon also provide services such as advertising to sellers, vendors, publishers and authors.
The company report on revenues across 6 different categories; Online stores, physical stores, third-party seller services, subscription services, AWS and ‘other’. We will touch on that a little more when we come to evaluate their revenue sources.
Before we do that it would be beneficial to break down how they serve each of the segments.
Consumers
Amazon serve consumers through online and physical stores where the focus is selection, price and convenience. The stores are designed in a way that facilitate the sale of millions of products, sold both by Amazon and third-party sellers.
The primary source of income, when we consider online and physical stores, is of course Amazon’s online presence. For the FY 2019, Amazon generated $280.5 Billion in sales across their six operating segments. Online stores accounted for $141.2 Billion (50.3%) and physical stores accounted for $17.1 Billion (6%).
Online stores sales are their largest revenue driver and facilitate the purchase and sale of an unimaginable range of goods, ranging from cars, to groceries (Amazon Pantry), to kids toys, to clothing, to books, to just about anything that is legal to sell online.
Amazon services can be accessed via the Amazon website, the Amazon mobile app, Alexa (Amazon’s virtual AI assistant device), devices, streaming and their physical stores.
Amazon also produce their own consumer electronic devices such as the Kindle, Alexa, Fire Tablet, Fire TV, Echo and Ring, as well as producing media content for consumers.
As well will see shortly, the ecosystem Amazon have created is something quite unique. For instance, the Amazon Prime service allows subscribers to access the Amazon Prime TV network, which is essentially Amazon’s own version of Netflix. The Amazon Prime subscription also entitles subscribers to receive unlimited free shipping of goods on over 100 million items in their online stores.
Sellers
Amazon fulfil the needs of sellers by facilitating the growth of their online businesses. This is done via the access to selling tools on Amazon’s online stores, which also enables sellers to benefit from Amazon’s fulfilment services (handling the warehousing and shipping of goods). Amazon profit from this by simply taking either; fixed fees, percentages of sales, per-unit activity fees, interest, or some combination of the above.
Sellers in this way are granted access to one of the largest online retail environments and can take advantage of Amazon’s superior fulfilment services. This has been the topic of some controversy in the past, as smaller sellers and independent ‘mom and pop’ stores essentially have to partner with Amazon or be at risk of falling behind. At the end of the day, it’s a killer business model.
Developers and Enterprises
Amazon cater to a host of different enterprises from start-ups, to academic institutions, to government bodies through their AWS segment. Amazon Web Services (AWS) is a subsidiary of Amazon providing on-demand cloud computing platforms and APIs on a pay as you go basis.
Content Creators
Amazon assist a range of content creators via their Kindle Store, Kindle Direct Publishing and Amazon Publishing.
Kindle Direct Publishing is an online services that allows independent authors and publishers make their books available on the Kindle Store or Amazon Publishing, whereby they will select a royalty program that will kick back some earnings to Amazon in return.
For anyone unware, the Kindle is a range of e-readers designed by Amazon that allows users to download and read books, newspapers and other digital media.

Amazon also offer programs that allow authors, musicians, filmmakers, app developers and others to publish and sell content too.
Competition
Amazon are a company that operate across a range of different segments and industries, so the level of competition is unsurprisingly high.
For instance, the Amazon Prime TV station will face competition from other streaming services such as Disney +, Apple TV, Netflix, Hulu and more.
The Amazon online stores, will of course face competition from other e-commerce/retail platforms such as Ebay, Shopify and Alibaba to name only a few.
Amazon list their primary competition as follows:
• Physical, E-commerce and omnichannel retailers, publishers, vendors, distributors, manufacturers and producers of the products they sell to consumers.
•Publishers, producers, and distributors of physical, digital and interactive media of all types and all distribution channels.
• Web search engines, comparison shopping websites, social networks, web portals and other online and app-based means of discovering, using, or acquiring goods and services, either directly or in collaboration with other retailers.
• Companies that provide e-commerce services, including website development and hosting, omnichannel sales, inventory, and supply chain management, advertising, fulfillment, customer service, and payments processing.
• Companies that provide fulfillment and logistics services for themselves or for third parties, whether online or offline.
• Companies that provide information technology services or products, including on-premise or cloud-based infrastructure and other services
• Companies that design, manufacture, market, or sell consumer electronics, telecommunication, and electronic devices
• Companies that sell grocery products online and in physical stores.
So just a few then….
Revenue Sources:
As we previously mentioned, Amazon have a range of revenue components that make up their net sales figure each financial year. Here we will touch upon each one individually.
One Amazon’s income statement the company do not break down their revenues into the six assorted segments, but we can find this information further down in the notes to the financial statements. Below is an excerpt from the 2019 Annual Report filing.

As we can see, the company break down their revenues into; online stores, physical stores, third party-sellers services, subscriptions, AWS, and other.
The overall composition of the revenue sources indicate that online store sales are the largest component, followed by third-party seller services and then AWS.

Interestingly, it appears as though Amazon are effectively diversifying their revenues as of late, with their largest component falling a little over 10% from 2017. Every other component, across the same time period has increased in weighting.
This has all occurred whilst the company have expanded their revenues by +388.7%, operating income by +247.7% and free cash flow by +130.4%. So it clearly has not hurt Amazon.

In terms of revenue sources, let us now break down each of the revenue components and provide a little flavor as to what they entail.
Online Stores:
The online store segment is includes the product sales and digital media content and is the largest component of sales, with a 50.35% weighting in the FY 2019. Amazon leverage their retail infrastructure to offer a wide range of consumable and durable goods that includes media products both in the tangible and intangible form, such as books, music, videos, games, and software.

The bulk of these product and service offerings will be found on their online store (see above). Any digital product subscriptions will be found in the ‘subscription’ revenues section.
Physical Stores:
Amazon’s physical stores are interesting and equate to around 6.13% of revenues as of FY 2019. When you generate the ridiculous earnings that Amazon do, i guess you can afford to experiment. Amazon did receive some shtick when they released their first brick and mortar stores back in 2015, but now operate a range of different stores types which we shall discuss now.
All revenues in the physical stores section are related to product sales where customers physically acquire items in a store. Any items that are purchased online, and picked-up in store, do not count towards physical store revenues.
Amazon operate a small number of own-brand stores, with the bulk of their physical presence coming from their acquisition of Wholefoods in 2017.

Source: Statista
According to Statista, Amazon operates ~500 Wholefood stores as of Q2 2020. The remaining 89 store counts are derived from a range of Amazon-branded stores such as Amazon Books, Amazon 4-Star, Amazon Go, Amazon Go Groceries and Amazon Pop-Up.

• Wholefoods is primarily an American multinational supermarket chain which sells products free from hydrogenated fats and artificial colors, and makes up the bulk of Amazon’s physical store count.

• Amazon Books are fairly self-explanatory. They are brick and mortar books stores, that sell some of the higher-rated books (as per Amazon’s website) and spans across 21 locations as of June 2020.
• Amazon Go is a unique stores that utilizes the power of technology in some interesting ways. Amazon Go stores primarily stock ‘convenience’ items that are ready-made and ready to ‘Go’. The company state that they are primarily focused on selling breakfast, lunch and snacks.
The ‘checkout-free’ shopping experience uses a mixture of computer vision, sensor fusion and deep learning to develop what they call ‘Walk Out Technology’. WOT automatically detects when products are taken from or returned to the shelves and keeps track of them in a virtual cart. When consumers are done shopping they simply leave the store and will later be sent a recipe based on the items they took.
• Amazon Go Groceries is essentially the same concept, but focusses more on fresh produce, as well as having a richer product range.
Between the two stores types, Statista states that there around currently 28 stores in operation.

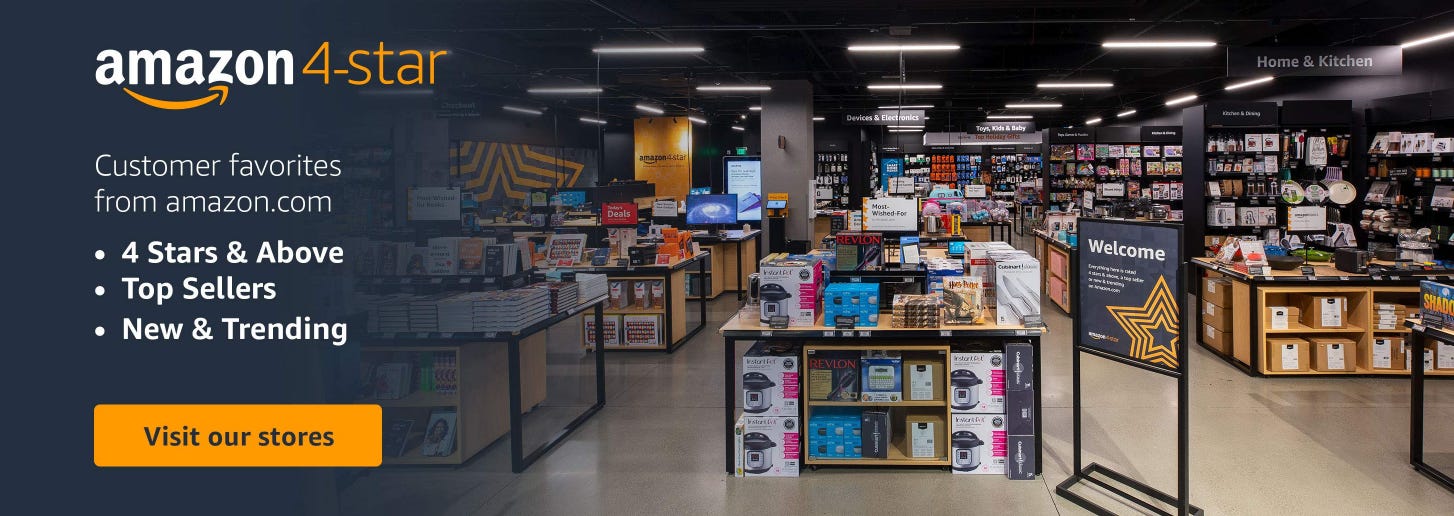
• Amazon 4-Star
The Amazon 4-Star stores are physical stores that contain a variety of items from the Amazon online store that have ratings of 4/5 or higher. Amazon usually place trending or new items in these stores. The products can range from consumers electronics, kitchen, home, toys, books, games and more. Additionally, for Amazon Prime members, they will be able to buy goods in these stores at the lower Amazon Prime prices.
• Amazon Pop-up stores are stand-alone kiosks that mainly showcase the company’s electronic devices like the Fire Tablet and Echo Speakers.
It seems as though Amazon won’t be keeping the pop-up stores around much longer as the number of stores have plummeted to just 8.

Third-Party Seller Services:
Amazon’s third-party seller services revenues are the second largest source of income, at 19.16% of FY 2019 revenues.
The incomes derived thereof, largely consist of the fees that Amazon take from sellers in return for access and use of Amazon’s fulfilment and shipping facilities, as well as the fees from other third-party seller services.
Subscription:
Amazon’s subscription revenues accounted for 6.85% of revenues in FY 2019 and are generated through the annual and monthly fees associated with Amazon Prime Memberships, of which there are ~150 Million members. Moreover, the company also collects fees from audiobook, digital video, digital music, e-book and other non-AWS services.
Below are some of the benefits that members are granted through their subscription to Amazon Prime, ranging from; free premium delivery, exclusive deals and offers, Amazon Originals, movies and TV shows and over 2 million ad free songs.

AWS:
Amazon Web Services (AWS) accounted for 12.49% of revenues in FY 2019, and is the third largest driver of revenues for the company.
AWS is the world’s most comprehensive and broadly adopted cloud platform, offering over 175 fully featured services from data centers globally. Millions of customers, including the fastest-growing startups, largest enterprises, and leading government agencies, are using AWS to lower costs, become more agile, and innovate faster.
AWS has significantly more services, and more features within those services, than any other cloud provider–from infrastructure technologies like compute, storage, and databases–to emerging technologies, such as machine learning and artificial intelligence, data lakes and analytics, and Internet of Things. This makes it faster, easier, and more cost effective to move your existing applications to the cloud and build nearly anything you can imagine.
AWS also has the deepest functionality within those services. The range of services, and the insights into each one, would consume a report far larger than the one i am writing today, so i will leave the link to check out each of the services here, so you can view at your leisure.

However, to provide a flavor, i have attached some of the features of the ‘Internet of Things’ and ‘Analytics’ services below.


AWS has the largest and most dynamic community, with millions of active customers and tens of thousands of partners globally. Customers across virtually every industry and of every size, including startups, enterprises, and public sector organizations, are running every imaginable use case on AWS. The AWS Partner Network includes thousands of systems integrators who specialize in AWS services and tens of thousands of independent software vendors (ISVs) who adapt their technology to work on AWS.
AWS is architected to be the most flexible and secure cloud computing environment available today. Our core infrastructure is built to satisfy the security requirements for the military, global banks, and other high-sensitivity organizations. This is backed by a deep set of cloud security tools, with 230 security, compliance, and governance services and features. AWS supports 90 security standards and compliance certifications, and all 117 AWS services that store customer data offer the ability to encrypt that data.
With AWS, you can leverage the latest technologies to experiment and innovate more quickly. We are continually accelerating our pace of innovation to invent entirely new technologies you can use to transform your business. For example, in 2014, AWS pioneered the serverless computing space with the launch of AWS Lambda, which lets developers run their code without provisioning or managing servers. And AWS built Amazon SageMaker, a fully managed machine learning service that empowers everyday developers and scientists to use machine learning–without any previous experience.
AWS has unmatched experience, maturity, reliability, security, and performance that you can depend upon for your most important applications. For over 13 years, AWS has been delivering cloud services to millions of customers around the world running a wide variety of use cases. AWS has the most operational experience, at greater scale, of any cloud provider.
AWS has the most extensive global cloud infrastructure. No other cloud provider offers as many Regions with multiple Availability Zones connected by low latency, high throughput, and highly redundant networking. AWS has 77 Availability Zones within 24 geographic regions around the world, and has announced plans for nine more Availability Zones and three more AWS Regions in Indonesia, Japan, and Spain. The AWS Region/Availability Zone model has been recognized by Gartner as the recommended approach for running enterprise applications that require high availability.

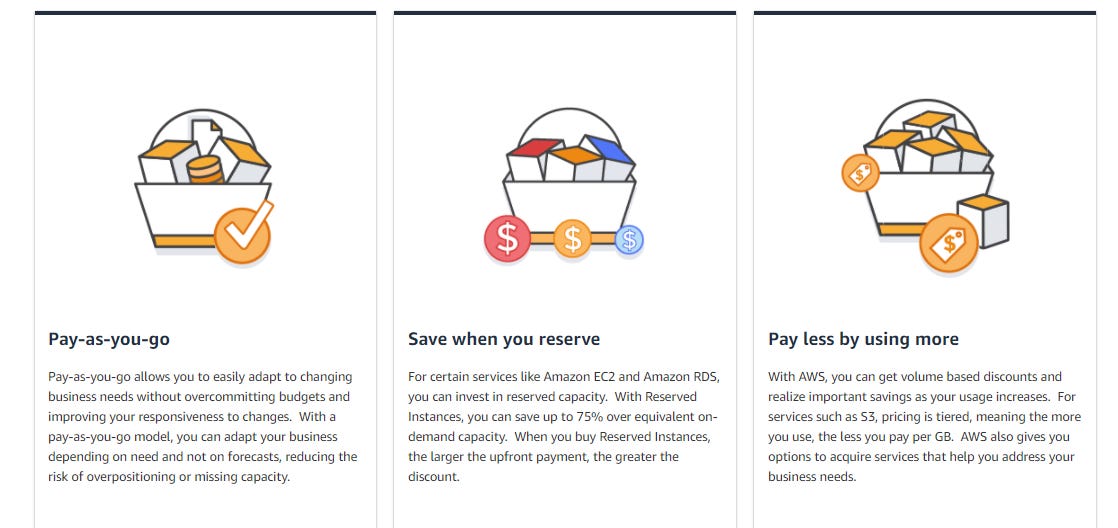
The AWS service is modelled as a pay as you go service that allows users to have some flexibility with the way they use the service based on their needs and usage.
Other:
Other revenues are generally formed from the sales of advertising services, as well as sales related to Amazon’s other service offerings. They don’t get much more specific on that front. As of FY 2019, other revenues account for ~5% of sales.
Geographic Composition
In terms of Amazon’s revenue geographic, the company derive the bulk of their revenues from the USA, with 69.03% coming from the US in 2019. The second largest component is ROW with 11.1%, third largest Germany with 7.93%, followed by the UK (6.25%) and Japan (5.7%).

Interestingly, the concentration of sales has strengthened within the US over a 5 year period with the US share growing by a 7.54% weighting from 2014. The only other geographic that has grown their weighting in this period is ROW, which has grown by 4.25%. In this time, Germany’s weighting has fallen 5.46%, UK has fallen 3.12% and Japan has fallen 3.19%.
However, if we scratch a little beneath the surface we can see that all of the geographic have grown fairly handsomely over the past 5 years.

It just so happens that the growth rates of the ROW and US segments have grown significantly faster, meaning they now dominate a larger slice of the overall weighting of revenues.

The above chart indicates the average 5 year growth rate of revenues on an annual basis. It is clear that the ROW and US segments are dominating. However, the annual growth rates of Germany, UK and Japan are still very impressive.
Now that we have covered the overview of what the company does, and how they generate their sales, we can now move forward and take a look at the financial performance of Amazon.
Financial Performance
Amazon has been a superpower stock since their IPO in the mid 90’s, destroying the returns of the S&P 500 by a wide margin.
An investor who bought $10,000 worth of Amazon common stock back in 1997, would now have holdings worth $14.81 Million if they left the position untouched.

It took Amazon around 6 years before they recorded their first year of positive operations and earnings, in 2003. From that point onwards the company turned into a cash generating machine.

Profitability
As of FY 2019, Amazon generated $280.52 Billion in sales, up +162.2% over 5 years. Gross profits were $74.75 Billion, up +240.6%, operating incomes were $14.5 Billion, up +551.2% and net income was $11.59 Billion, up 1,840% over 5 years.
The company generated $21.65 Billion in FY 2019, which is an improvement of +225.5% across 5 years.

The gross profit margin of Amazon has shown vast improvement across the last decade and has accelerated from ~12% tp a comfortable 26% in 2019. This is largely down the diversification of their revenue streams, branching into higher margin subscriptions, and greater efficiencies in their operating model.

The operating and earnings margins are fairly tight with FY 2019 operational margins of 5.18% and net income margins on 4.13% for 2019.

Amazon report revenues on the income statement as being both ‘product’ and ‘service’. If we circle back to 2011, service revenues accounted for just 12.64% of Amazon’s annual revenues. By 2016, that figure had increased to 30.39%. Fast forward to 2019, and service revenues now account for 42.8% of revenues.

This dramatic swing in revenue weighting occurred in unison with Amazon’s impressive improvement in gross margin. Its clear that the penetration of higher margin services revenues has been a key factor in their ability to reinvest in the business from the excess cash flows they were able to produce from having a fatter gross margin.

We have already spent some time discussing the sources of revenue that Amazon fuel their business with, as well as the descriptions of each segment.
We can see that in 2019, Amazon generated $280.5 Billion in sales and after cost of goods sales of $165.5 Billion and operating expenses of $100 Billion are deducted, the company reported $14.51 Billion in operational income and $11.5 Billion in net income.

Comparable to some firms we have discussed in the past, Amazon’s gross line is relatively low. That is not to say that it is ‘too low’ for a firm of their stature or industry. They have heavy (and expected) operational expenses. So, i figured it would be useful to the reader to understand just what those expenses are derived from.
Cost of Sales
The cost of sales sums to $165 Billion in FY 2019, which is the largest expense that weighs on the revenues at about 58%. Amazon assigns costs of sales from the purchase price of consumer goods, inbound and outbound shipping costs, including costs related to sortation and delivery centers and where Amazon are the transportation service provide. As well as this they also record digital media content costs, video and music.
The cost of sales are a factor that simply increase as the volume of sales increases.
Fulfilment
Fulfilment costs for FY 2019 were $40.2 Billion, or 14.3% of revenues. Fulfilment represents the the largest operational expense, behind the cost of sales.
Amazon record fulfilment costs as costs incurred in the operating and staffing of fulfillment centers, physical stores and customer service centers. This also includes payments processing costs, including AWS payment processing. However, its important to note that AWS costs are primarily classified as technology and content costs.
Fulfilment costs will vary depending on the level of productivity, volume, size and weight of units that are received and fulfilled, and the extent to which third-party sellers chose to use the Amazon fulfilment services.
Technology and Content
Tech and content expenses were $35 Billion in FY 2019 and is primarily deducted for costs involving the research and development of new and existing products, services, development and design. There are also certain infrastructure costs included here such as servers, networking equipment, utilities, data center related depreciation and amortization and other expenses that are required to support AWS and other Amazon businesses. Amazon state that these costs reflect the investments made to ensure a wide variety of products and services to consumers.
Marketing
Marketing expenses in the previous year came in at around $18.8 Billion for the period. These expenses include advertising and payroll related expenses for employees engaged in the marketing and selling activities of the business, including sales commissions related to AWS. These marketing activities can include sponsored search, third party customer referrals, social and online advertising, TV ads and other initiatives.
Marketing is likely one of Amazon’s most variable expenses in that they can alter them with respect to the growth rates in sales and so on.
General and Administrative (G&A)
General and administrative expenses, $5 Billion in FY 2019, are primarily consist of costs for corporate functions, including payroll and related expenses; facilities and equipment expenses, such as depreciation and amortization expense and rent; and professional fees and litigation costs.
Other Operating Expense/Income
Other operating expense (income), net, consists primarily of marketing-related, contract-based, and customer-related intangible asset amortization expense, and expenses related to legal settlements. These expenses are relative small beans, with just $200 Million expensed in FY 2019.
The level of interest expense, which is largely the interest on outstanding debt, is fairly small despite Amazon significant levels of debt (which we shall discuss in the liquidity section. Slicing just 11% from the operational income, this is an improvement from the 20% in 2017.

You will find that for the most part, Amazon manage to brush past a lot of their potential issues due to the fact that earnings continue to compound.
For instance, we just finished detailing the operational expenses which, relative to revenues, have been growing at a greater pace over the last 5 years. When you generate $280 Billion in a given year, it is for sure more difficult to grow that faster than you can your expenses in purely numeric terms, but we can also see that the growth rate of earnings (net income) have been far outpacing any expenses.
This is feeds into Amazon’s efficiency and product diversification. With fatter gross margins, come greater ability to increase operational expenses and expand the business. Amazon are clearly an efficient allocator, seeing that expenses are climbing, their earnings margin is growing fatter each year.

YTD Performance
Amazon have had a fairly stellar year thus far, when we consider the global disruption that corona virus has caused. Sales of $164.3 Billion, looking set to smash FY 2019’s annual revenue figure.
Operating income of $9.8 Billion and net income of $7.7 Billion so far, also look set the drive home another year of improvement, which is not surprising.

Now that we have glanced over the performance of Amazon, we can then move on to the liquidity of the company.
Liquidity
Amazon have a fairly strong balance sheet. Whilst they are in the business of offering some considerably high margin service offerings, let us not forget for the most part they are in the retail business, so the level of current assets over current obligations is not expected to be as high as a SAAS firm.
Amazon are a heavy cash flow producer, and these cash flows allow them to run on relatively lower current ratios (CA/CL).

Cash of $37 Billion plus the $33.9 Billion in marketable securities is a hefty cushion that covers their $33 Billion debt pile.
You may notice that the level of current assets (assets that will be cash within one year) are $110.9 Billion, and the level of current obligations (due within one year) are $93 Billion.
This leads to a current ratio of 1.18 times current obligations.

When we consider more service-y or platform-y or tech-y or SAAS-y type firms who have far greater levels of liquidity we have to realise that these are not fair comparisons.
In order for me to truly show you the liquidity strength that Amazon has, i will now highlight the impressive efficiency of Amazon in terms of their logistics with inventory, payables and receivables.
But first let us clarify a few things:
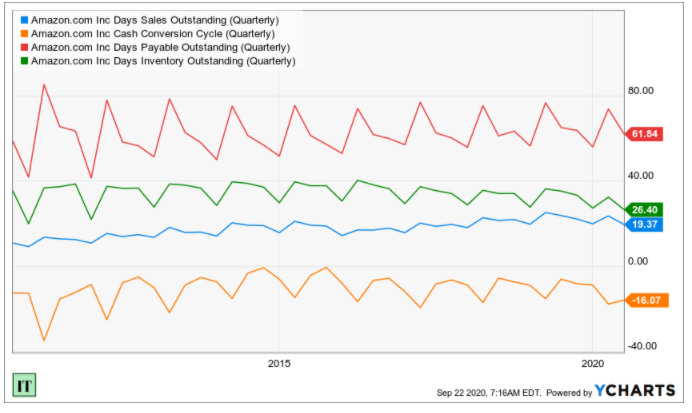
•Days Payables Outstanding : DPO reflects the number of days it takes Amazon to pay their creditors for the supplies they purchase.
•Days Inventory Outstanding: DIO Reflects the number of days inventory is held before sale.
• Days Sales Outstanding: DSO reflects the efficiency of Amazon in collecting the cash that is due to them (receivables). The DSO reflects the time between the sale of an item and the cash collection, in days.
• Cash Conversion Cycle: In the CCC we perform a calculation including the three ratios above and the outcome will show us the time elapsed from the point the company invests in the working capital, until the point cash is collected from that working capital.
Cash Conversion Cycle = DIO + DSO - DPO
In this instance that would equate to:
26.4 + 19.37 - 61.84 = (16.07)
So what does this actually mean?
First, note how is takes 61.84 days on average for Amazon to pay their creditors after Amazon purchases from them. Then note that it takes on average 19.37 days to collect cash for the sale of those goods. Think of it in a simplified way.
Amazon buy goods on credit, then sell those goods and receive the cash for those goods, months before they ever have to pay for the goods they just sold.
That is efficiency.
Balancing their leverage with suppliers with their tight controls on collecting payments means that Amazon typically collect the cash from the investments in working capital weeks before they pay for the goods. Typically, the lower the cash conversion cycle, the better. When firms have negative cash conversion cycles, it means they have superior operational efficiency.
Amazon need not have an excess of current assets that are 5 or 6 times their current obligations because they sell goods and collect the cash for those goods long before they ever have to pay for them.
Coming back to debt for a moment, Amazon have raised some significant debt over the last decade, now standing at $33 Billion.

This is not uber concerning from my point of view. When we glance at their repayment schedule, the debts stretch as far out as 2060, and the interest rates on that debt is pretty low.

Additionally, with the level of free cash flow that Amazon generation each quarter, i think they will have no issues covering any principal repayments when they come to maturity if they need to do so. Free cash flow is the cash that a company has free to allocate towards internal investment, dividends, retained earnings, cash pile, debt repayment and share buybacks (to name a few options).

Overall, the thing that strikes as most impressive, is Amazon’s superior operational efficiency . Solid Balance sheet by all accounts.
The Cash Flows
I have alluded to it a few times throughout this piece, but Amazon are well known for their ability to produce excellent cash flows for their business. Partially due to the superior operational efficiency they demonstrate.
Ona quarterly basis, Amazon are generating the majority of their cash flows from their operations, which is to be expected from a company of their size.

If we wish to smooth that out and look at the flows on an annual basis that becomes a great deal more apparent.

The level of free cash flow in the business is strong, and better yet, growing. On the trailing twelve month basis, Amazon are now pulling in free cash flows between $25 to $31 Billion each period. Free cash flows are vital as they are the funds the business has to plow back into the operations of the business.

Summary
Amazon were involved in the 2000 tech bubble crash, and eventually came out the other side and thrived, which is more than we can say for some firms.
I don’t personally find the price to earnings ratio all that useful for firms that are still in the stage of growth the Amazon appear to be in. For a number of years, Amazon purposefully suppressed their earnings level to continue focusing on the expansion of their business and ensuring the consumer benefited. This came at the cost of razor thin bottom line margins for a few decades, but, clearly, is now paying off.
The price to earnings ratio has slowly dwindled down to a, still huge, 117.12 times earnings compared to the 5 year average of 258 times. I personally don’t think it is so useful to look at the P/E here though.

In terms of the price to sales ratio, Amazon are rarely trading at a level that would dip below the 5 year average of 3.4 times sales. Currently trading around the 4.7 times mark.

The company have a great number of things going for it. Revenues still growing at an attractive rate for such a large organization, earnings growth, low levels of debt, a 5 year average return on equity of 17.16%, booming free cash flow growth, climbing gross margins, and more.

In terms of valuation, it looks like Amazon are one of those companies that have mostly always been somewhat ‘overpriced’ relative to their peers. However, at the same time, they are not really in any way similar to their peers too, which is perhaps the reason their common stock has been such a strong performer over the last decade.
Either way, i think that about wraps up the business overview of Amazon.
I hope you learned something new today
We will next take on the business overview of Roku, and then post another survey so we can vote for some new firms to analyze.
Until next time
IT